Interactive Field Tour to the EFForTS project

Welcome to the Interactive Field Tour to the EFForTS (Ecological and Socioeconomic Functions of Tropical Lowland Rainforest Transformation Systems) project. By clicking on one of the five station icons below, you can directly jump into the map and zoom to the respective station. Alternatively, you may use the large pulsing icon on the right side to begin your interactive tour in an overview position and explore the project on your own. The navbar and map marker are explained at the bottom of this page.
Enjoy your tour.

What did EFForTS do since Phase 1 (2012 - 2015) on the so-called "core plots"? Dive in and find out with us. We will also take you on a guided tour of our flagship integrative project for Phase 3 (2020 - 2023), the Landscape Assessment.
How to alleviate negative ecological impacts in existing oil palm plantations? We established a biodiversity enrichment experiment (EFForTS-BEE) to test if tree island planting is a good strategy. In Station 2, you will visit the experimental plots and discover the activities in the field.
Which practical solutions can be implemented to reduce negative effects of intensive oil palm management without sacrificing productivity and profit? Is the oil palm plantation a source or a sink of greenhouse gases and how do management practices, seasonality or extreme meteorological events affect the greenhouse gas balance? These are the main research questions of Station 3. Follow us on a brief behind-the-scenes tour of our research in a mature oil palm plantation!
The region and its people: take a trip to one of our research villages and explore the social and economic heterogeneity of our study region! What are the socio-economic benefits of land use change? What are the drawbacks of plantation agriculture? Learn about our scientific methods, our findings and future research and applications.
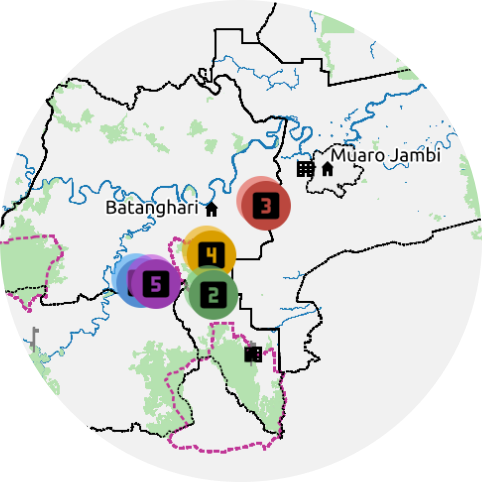
Why does a research project need a whole subproject dedicated to coordination? This is the topic of Station 5. In addition you will get information about the involved Indonesian universities, see the established research infrastructure and get an impression of Jambi town.

The map interface

Navbar
To zoom the map in and out use either these buttons or the scroll wheel of your mouse.
The map outlines the geographical location of the field sites. By clicking on Phase 2 or Phase 3 you will find the areas that have been investigated in the period from 2016 to 2019 and from 2020 to 2023, respectively. By clicking on Human dimensions you will see the research villages of the socioeconomic group.
The home button resets the zoom level, activates all station marker and re-centers the map.
With the forwards and backwards buttons you can go through your map history.
The last button brings you back to this page.

The number icons represent the five specific field stations (see above). By clicking on the button the map will zoom and bring you directly to the station of your choice. Only the corresponding markers appear, all other markers are deactivated.
You can switch on and of a legend with specific information depending on the active layer.
Map marker
Start a guided tour video.
Jump into a 360°-tour or explore an image.
Open an image or image collection.
Watch a video.
Back to main
EFForTS page